- Story
A map that gives more room to trees
23.06.2025 Trees are essential for the urban climate. However, this important function is not reflected on maps. A research project of BFH and the University of Bern aims to change this.
Key points at a glance
- Trees are important for maintaining a good climate in urban areas.
- Conventional maps do not adequately depict the importance and function of trees.
- A research project aims to visualise tree habitats on maps.
What is the aim of the urban tree mapping project?
Trees play a crucial role in urban areas. They improve the urban climate, promote people’s well-being and support biodiversity. In view of the number of challenges posed by climate change, it is becoming increasingly important for urban planning to take the diverse functions and needs of trees into account.
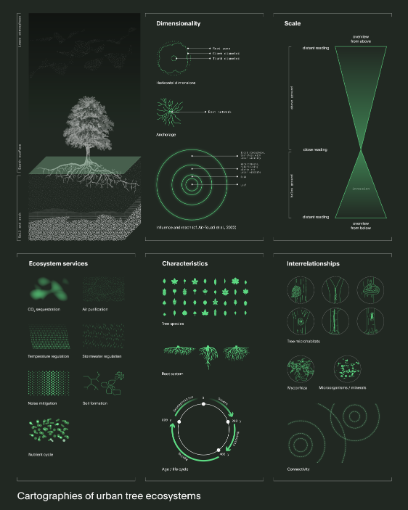
Until now, however, there has been a lack of suitable maps that clearly illustrate this type of information. Conventional maps only show where trees are located – but not which biotope they require and how they influence their surroundings, for example in terms of shade, cooling effect or as a habitat. The project’s aim is to help ensure that maps convey such information in future and do justice to the manifold importance of trees.
Who will work with the extended maps?
The maps are intended to set out new guidelines for improving planning instruments. They could also serve as a working tool for planners, for example in the context of construction projects or issues pertaining to land use. Today, the voice of biodiversity is not given much consideration during the design of buildings and urban spaces. However, it would be in the interests of fauna, flora and human beings if they were listened to more effectively during planning, design and approval procedures.

Even small nuances can impact the message conveyed by a map.
How is the research project structured?
Collaboration across several disciplines, including design, the digital humanities, geography and ecology, plays a central role in the project. The first step is to examine how ecological maps are created, structured and interpreted. This is to be followed by a clarification of what information the maps should contain about trees, but also how their influence on their environment can be represented. The end result will be prototype maps that accurately depict the habitat and needs of trees.
Are initial findings already available?
Previous work has shown that even small nuances influence the message of a map. Streets are an example of this. They are consistently shown in white on maps, i.e. as actual empty space. Conversely, the impact of roads and their associated activities on the surrounding environment and living beings is significant.
The study has the potential to optimise planning tools.
What is the main challenge associated with the project?
Cartography is a field characterised by numerous established standards and conventions. These conventions can, however, hinder our ability to visualise maps and their digital possibilities in a new way. But such adjustments take time and persuasion.
How does the project benefit society?
The study has the potential to optimise planning tools and thus create a basis for planners to better deal with the challenges posed by climate change. More comprehensive visualisations of spaces as ‘biotopes’ can help with urban planning, offering residents enhanced protection from the increasing summer heat. Furthermore, they can generally serve as a planning compass for more sustainable development.
More about the project and the BFH expert behind it
The project on the mapping of urban tree populations is a collaboration between BFH and the University of Bern. It is supported by the Swiss National Science Foundation and headed by Katharina Scheller. It is also the subject of her dissertation at the University of Bern.
Katharina Scheller is a communication designer and associated researcher at the Institute of Design Research at Bern University of the Arts (HKB). Her work focuses on communication design, cartography, ecological mapping and knowledge visualisation.